Monthly Gantt Chart with Data
This template provides a visual representation of project timelines and task durations across a 12-month period.
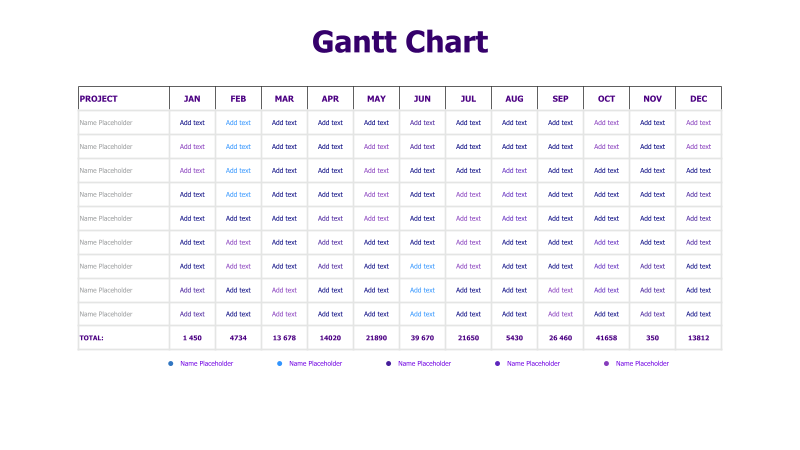
Layout & Structure: The template features a Gantt chart layout with months displayed as columns (January to December) and project tasks listed as rows. Each cell represents a time period for a specific task, filled with a color indicating progress or status. The chart includes a total row displaying cumulative data for each month.
Style: The chart utilizes a clean and professional aesthetic with a simple color scheme. The use of a grid structure and clear labeling enhances readability. The template is designed for data visualization and project management.
Use Cases:
- Project planning and scheduling
- Tracking task progress over time
- Resource allocation and management
- Presenting project timelines to stakeholders
- Monitoring project milestones and deadlines
Key Features:
- Clear monthly breakdown
- Visual representation of task durations
- Total data for each month
- Easy-to-understand format
- Suitable for various project types
Tags:
Ready to Get Started?
Impress your audience and streamline your workflow with GraphiSlides!
Install Free Add-onNo credit card required for free plan.