4-Point Editable Colored Coins Chart Infographic
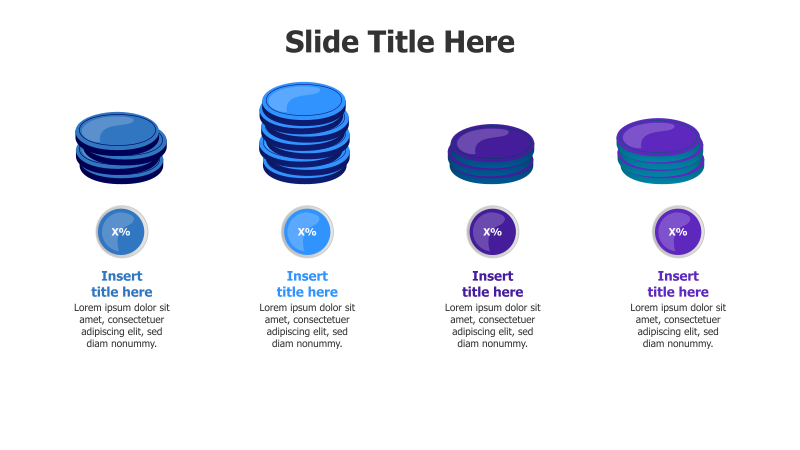
This template presents information using four stacked coin graphics, each representing a distinct point or category.
Layout & Structure: The slide features four vertically aligned stacks of coins, each with a different color (green, blue, red, purple). Below each stack is a circular element displaying "X%" and a placeholder for a title and descriptive text. The arrangement creates a clear, linear progression of information.
Style: The template utilizes a modern aesthetic with a 3D effect applied to the coin stacks, creating depth and visual interest. Subtle shadows enhance the 3D appearance. The color scheme is vibrant and professional.
Use Cases:
- Presenting key performance indicators (KPIs).
- Illustrating the relative importance of different factors.
- Comparing contributions from various teams or departments.
- Showcasing the stages of a process or project.
- Highlighting different product features or benefits.
Key Features:
- Fully editable colors and text.
- Visually appealing 3D coin graphics.
- Clear and concise presentation of data.
- Easy to understand and interpret.
- Suitable for a wide range of business presentations.
Tags:
Ready to Get Started?
Impress your audience and streamline your workflow with GraphiSlides!
Install Free Add-onNo credit card required for free plan.