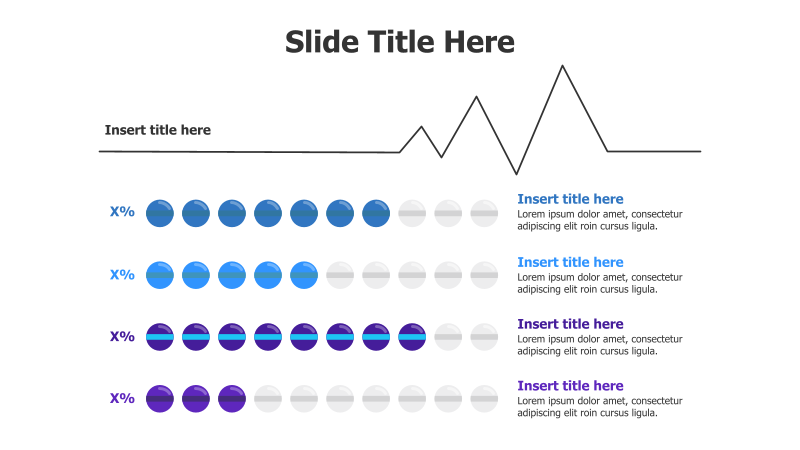
4-Row Pill Chart with Line Graph
This template features a visually engaging way to represent progress or levels across multiple categories.
Layout & Structure: The slide is divided into four horizontal rows, each containing a series of circular "pills" that transition from a solid color to a grayscale gradient, indicating progress or completion. A line graph is positioned above the pill charts, potentially representing an overarching trend or metric. Each row has a corresponding text area for titles and descriptions.
Style: The template employs a modern aesthetic with a clean design. The use of color gradients and circular shapes creates a visually appealing and intuitive representation of data. The color scheme is vibrant and professional.
Use Cases:
- Presenting progress towards multiple goals.
- Comparing performance across different teams or departments.
- Illustrating stages of a process or project.
- Showcasing levels of expertise or skill.
- Visualizing customer satisfaction scores across different attributes.
Key Features:
- Visually appealing and easy to understand.
- Fully customizable colors and text.
- Clear representation of progress or levels.
- Suitable for a wide range of data and presentations.
Tags:
Ready to Get Started?
Impress your audience and streamline your workflow with GraphiSlides!
Install Free Add-onNo credit card required for free plan.