Gradient Meters
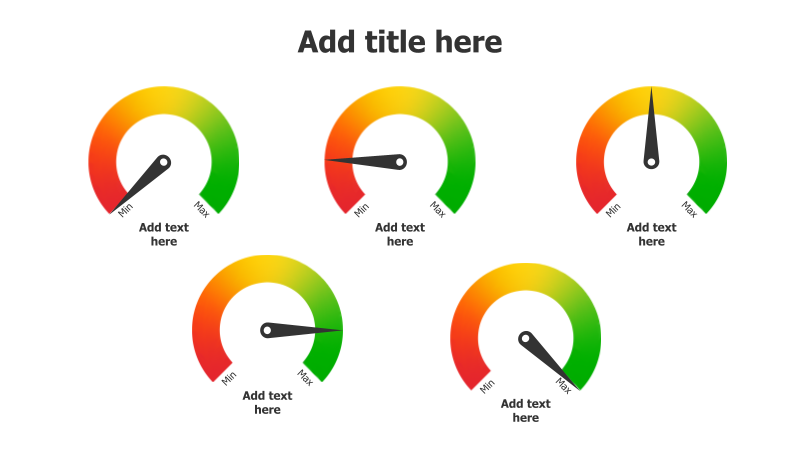
This slide features a set of six gradient-filled meter gauges, ideal for visualizing performance indicators or progress levels.
Layout & Structure: The template displays six circular gauges arranged in two rows of three. Each gauge has a needle pointing to a value between 'Min' and 'Max'. The gauges are designed to represent a range of values, with color gradients indicating performance or status. Each gauge also includes a placeholder for descriptive text.
Style: The slide utilizes a modern aesthetic with vibrant gradient fills (red, orange, yellow, and green) within each gauge. The use of gradients adds visual interest and helps to quickly convey information. The overall style is clean and professional.
Use Cases:
- Tracking key performance indicators (KPIs).
- Visualizing project progress.
- Representing risk levels.
- Showing performance against targets.
- Illustrating resource allocation.
- Presenting survey results or feedback scores.
Key Features:
- Visually appealing gradient design.
- Clear and intuitive gauge representation.
- Fully customizable colors and values.
- Easy-to-understand 'Min' and 'Max' indicators.
- Placeholder text for detailed explanations.
Tags:
Ready to Get Started?
Impress your audience and streamline your workflow with GraphiSlides!
Install Free Add-onNo credit card required for free plan.