Brain Percentage Infographic
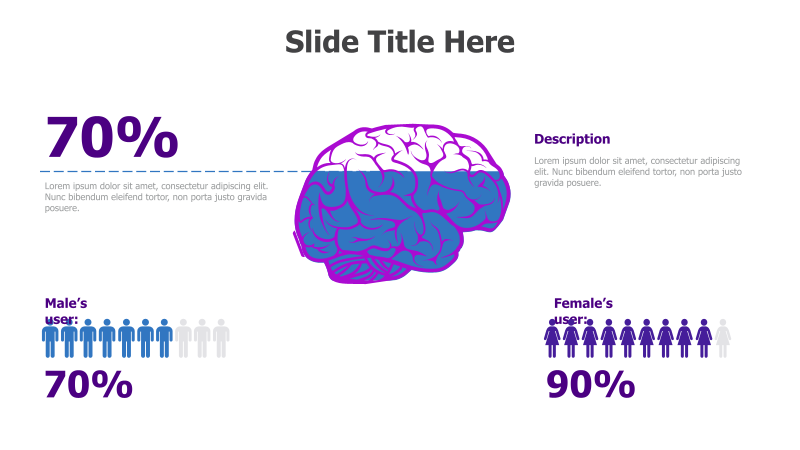
This infographic template visually represents percentage data using a brain graphic and user icons. It's ideal for showcasing statistics related to cognitive abilities, user demographics, or survey results.
Layout & Structure: The template features a central brain illustration split into two colored hemispheres. Percentage values are prominently displayed on the left and bottom, accompanied by descriptive text. User icons are used to represent male and female demographics, with corresponding percentages. The layout is divided into distinct sections for overall percentage, description, and gender-specific data.
Style: The design employs a modern aesthetic with a vibrant color scheme (purple and blue). The brain graphic adds a unique and engaging visual element. The use of flat icons and clean typography contributes to a professional and easily digestible presentation.
Use Cases:
- Presenting survey results on cognitive performance.
- Illustrating gender differences in skill sets or preferences.
- Highlighting user engagement metrics.
- Demonstrating the impact of a program or intervention on brain activity.
- Reporting on research findings related to brain health.
Key Features:
- Visually appealing brain graphic.
- Clear and concise presentation of percentage data.
- Gender-specific data representation.
- Fully customizable colors and text.
- Easy-to-understand layout.
Tags:
Ready to Get Started?
Impress your audience and streamline your workflow with GraphiSlides!
Install Free Add-onNo credit card required for free plan.