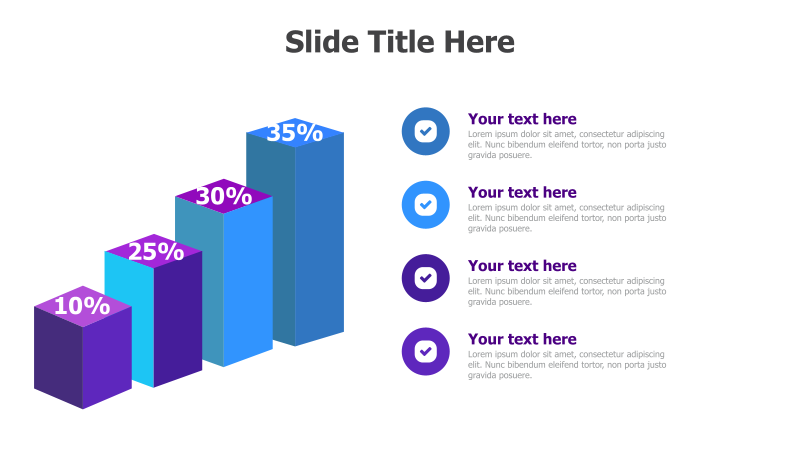
4-Point 3D Column Diagram
This template presents data or concepts using a visually engaging 3D column chart. It's ideal for showcasing proportional relationships or sequential steps.
Layout & Structure: The template features four vertically stacked, 3D columns of varying heights, representing different percentages. The columns are arranged in ascending order, creating a pyramid-like structure. Each column is clearly labeled with its corresponding percentage value.
Style: The design incorporates a modern aesthetic with a vibrant blue and purple color scheme. The 3D effect adds depth and visual interest, while subtle shadows enhance the overall presentation. The use of clean lines and a minimalist background contributes to a professional look.
Use Cases:
- Presenting market share data.
- Illustrating project progress with key milestones.
- Demonstrating the relative importance of different factors.
- Visualizing survey results or customer feedback.
- Showing the stages of a process or workflow.
Key Features:
- Fully editable shapes and text.
- Clear visual hierarchy for easy understanding.
- Engaging 3D effect to capture attention.
- Versatile design suitable for various data types.
- Professional color palette for a polished look.
Tags:
Ready to Get Started?
Impress your audience and streamline your workflow with GraphiSlides!
Install Free Add-onNo credit card required for free plan.