SWOT Analysis Meter
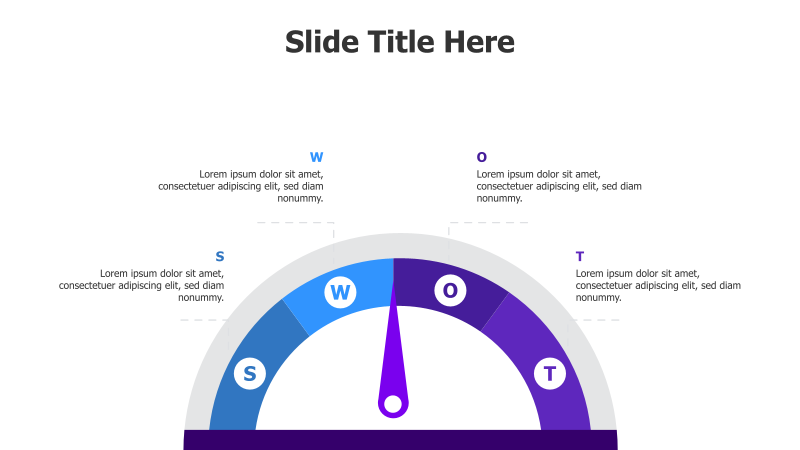
This template presents a visually engaging meter-style infographic for conducting a SWOT analysis. It's designed to highlight key strengths, weaknesses, opportunities, and threats.
Layout & Structure:
- The template features a circular meter gauge with four distinct sections representing SWOT elements (Strengths, Weaknesses, Opportunities, Threats).
- Each section is color-coded and labeled with a corresponding letter (S, W, O, T).
- A central needle points to a specific area, potentially indicating focus or priority.
- Text boxes are provided alongside each section for detailed descriptions.
Style:
- The design incorporates a modern aesthetic with a gradient color scheme.
- A subtle shadow effect adds depth and visual appeal.
- The use of a meter gauge creates a dynamic and impactful presentation.
- The overall style is professional and suitable for business presentations.
Use Cases:
- Strategic planning sessions
- Market analysis presentations
- Competitive assessments
- Project risk evaluations
- Business development reports
Key Features:
- Visually appealing meter gauge design
- Clear labeling of SWOT elements
- Customizable color scheme
- Editable text boxes for detailed analysis
- Suitable for a wide range of business applications
Tags:
swotanalysismetergaugestrengthsweaknessesopportunitiesthreatsbusinessstrategyinfographiccircular4 pointsmarketingplanning
Ready to Get Started?
Impress your audience and streamline your workflow with GraphiSlides!
Install Free Add-onNo credit card required for free plan.