6-Point Comparison with Connected Sectors
This template presents a comparison across six distinct points, visually organized into three interconnected sectors. It's ideal for showcasing relationships and dependencies between different elements.
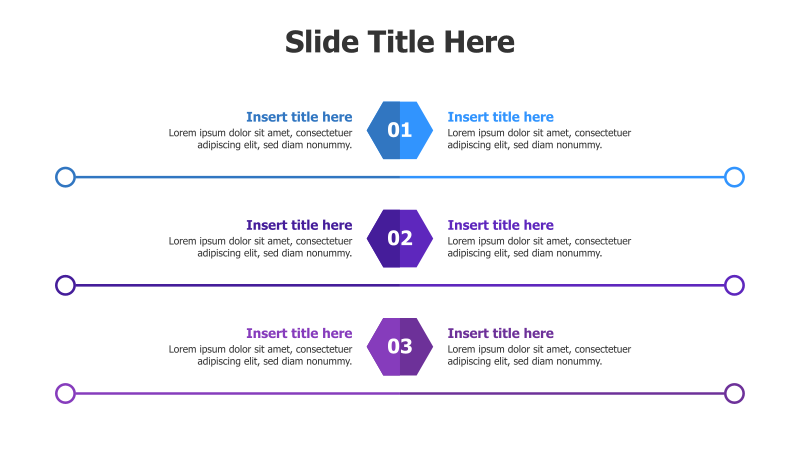
Layout & Structure: The template features six content blocks arranged in three pairs, connected by horizontal lines. Each pair represents a sector, and the lines visually link related points. Numbered indicators (01, 02, 03) highlight each sector. The layout is linear and flows from left to right.
Style: The design incorporates a modern aesthetic with a clean color palette of blue, purple, and white. Subtle gradients and rounded corners add visual appeal. The use of horizontal lines creates a sense of connection and flow. The overall style is professional and easy to understand.
Use Cases:
- Comparing different product features.
- Illustrating the stages of a process with interconnected steps.
- Presenting different aspects of a project and their dependencies.
- Analyzing competitive advantages and disadvantages.
- Showcasing different departments within an organization and their collaboration.
Key Features:
- Fully editable text and colors.
- Clear visual hierarchy for easy comprehension.
- Engaging connected design.
- Suitable for a variety of business and educational presentations.
- Professional and modern aesthetic.
Tags:
Ready to Get Started?
Impress your audience and streamline your workflow with GraphiSlides!
Install Free Add-onNo credit card required for free plan.