Semiannual Gantt Chart
This template presents a visual timeline for tracking project progress over a six-month period, divided into two halves.
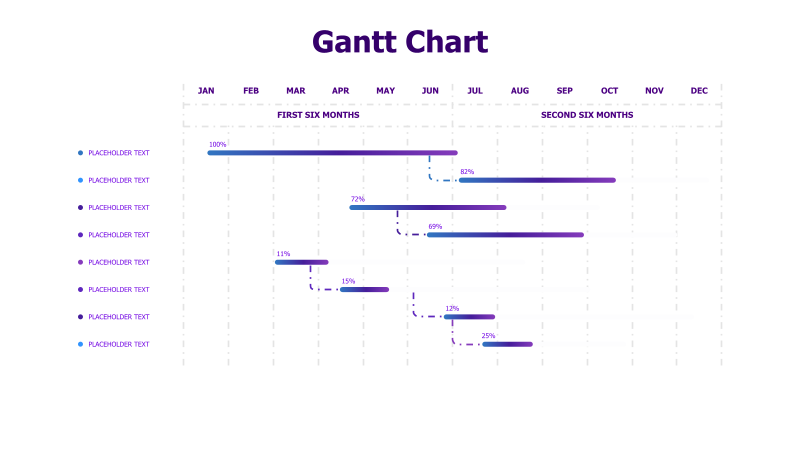
Layout & Structure: The template features a horizontal Gantt chart with a timeline spanning January to December. It displays eight distinct tasks or project phases represented by colored bars. Each bar indicates the percentage of completion for that task. The chart is divided into 'First Six Months' and 'Second Six Months' sections, visually separating the timeline.
Style: The chart employs a clean, modern aesthetic with a light purple and white color scheme. The bars are solid colors with percentage labels. The overall design is minimalist and professional, focusing on clarity and readability.
Use Cases:
- Project Management: Tracking task completion and deadlines.
- Timeline Visualization: Illustrating project phases over time.
- Progress Reporting: Communicating project status to stakeholders.
- Goal Setting: Visualizing progress towards achieving objectives.
- Roadmap Presentation: Displaying key milestones and deliverables.
Key Features:
- Clear visual representation of project timelines.
- Percentage completion indicators for each task.
- Easy-to-understand layout.
- Visually appealing color scheme.
- Suitable for a wide range of project management applications.
Tags:
Ready to Get Started?
Impress your audience and streamline your workflow with GraphiSlides!
Install Free Add-onNo credit card required for free plan.