Two Round Percentage Charts
This template features two circular charts designed to visually represent percentages or progress.
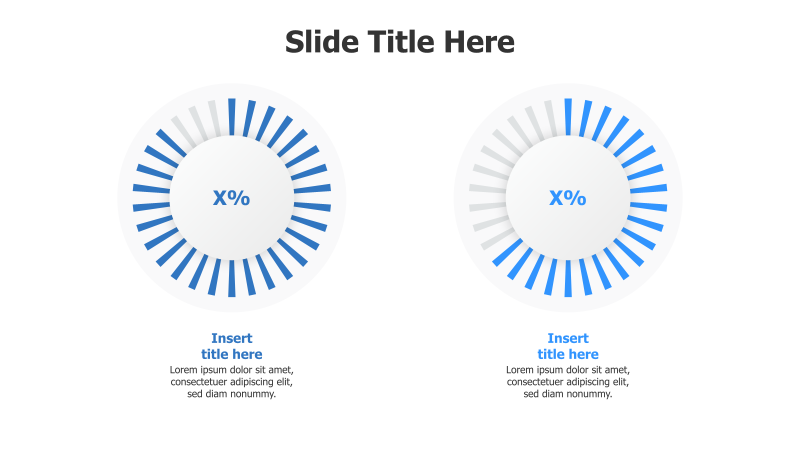
Layout & Structure: The slide contains two identical round charts positioned side-by-side. Each chart is composed of numerous radial segments, with a portion of the segments highlighted in blue to indicate a percentage. A central area within each circle displays the percentage value (X%). Below each chart is a placeholder for a title and descriptive text.
Style: The template employs a clean and modern aesthetic. The color palette is primarily blue and gray, with a white background. The charts have a flat design with subtle shadowing to create a sense of depth. The overall style is professional and easily adaptable to various branding guidelines.
Use Cases:
- Presenting project completion rates.
- Comparing performance metrics.
- Illustrating survey results.
- Showing progress towards goals.
- Highlighting key statistics.
Key Features:
- Visually appealing and easy to understand.
- Fully customizable percentage values and labels.
- Clean and professional design.
- Suitable for a wide range of data presentations.
Tags:
Ready to Get Started?
Impress your audience and streamline your workflow with GraphiSlides!
Install Free Add-onNo credit card required for free plan.