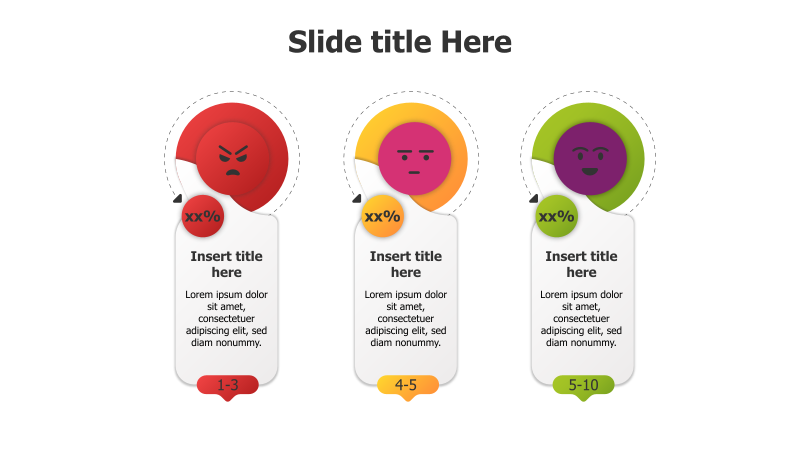
3-Point User Satisfaction Levels with Percentages
This template visually represents three distinct levels or categories, ideal for showcasing feedback or data points.
Layout & Structure: The template features three circular diagrams arranged horizontally. Each circle is segmented to represent a percentage, with an emoji face indicating a level of satisfaction (angry, neutral, happy). Below each circle is a text area for a title and description, and a numerical range is displayed at the bottom.
Style: The design incorporates a modern aesthetic with a 3D effect and subtle shadows, giving the circles depth. The color scheme uses red, yellow, and blue, creating a visually appealing and easily distinguishable layout. The use of emojis adds a friendly and approachable feel.
Use Cases:
- Presenting customer satisfaction levels.
- Illustrating user feedback on different features.
- Showing the distribution of opinions on a specific topic.
- Displaying survey results with varying degrees of positivity.
- Representing performance metrics across different categories.
Key Features:
- Clear visual representation of percentages.
- Engaging emoji icons for quick understanding.
- Customizable text areas for detailed explanations.
- Visually appealing 3D design.
- Easy to adapt to various data sets.
Tags:
Ready to Get Started?
Impress your audience and streamline your workflow with GraphiSlides!
Install Free Add-onNo credit card required for free plan.