Round Monthly Business Activity Chart
This template presents business activity data across a year using a circular chart format.
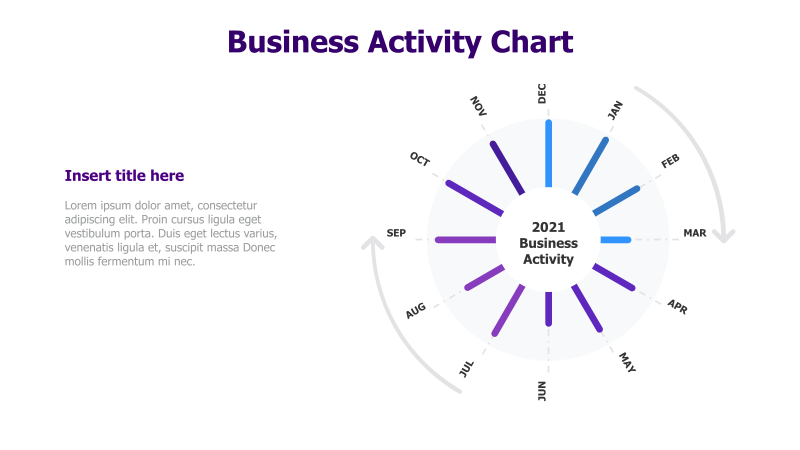
Layout & Structure: The slide features a circular chart divided into twelve segments, representing the months of the year (January to December). A central label indicates the year (2021 in the example). Colored bars extend from the center to the outer circle, visually representing activity levels for each month. Text labels for each month are positioned around the circumference. The left side of the slide includes a text placeholder for a title and a descriptive paragraph.
Style: The chart employs a clean, modern aesthetic with a light color palette. The use of radial bars creates a visually engaging representation of monthly data. The design is relatively minimalist, focusing on clarity and readability. Subtle gradients are used to enhance the visual appeal.
Use Cases:
- Tracking monthly sales performance.
- Illustrating seasonal trends in business activity.
- Presenting project milestones across a year.
- Visualizing marketing campaign results by month.
- Demonstrating website traffic fluctuations throughout the year.
Key Features:
- Clear monthly breakdown.
- Visually appealing circular design.
- Easy-to-understand data representation.
- Customizable colors and labels.
- Suitable for a wide range of business data.
Tags:
Ready to Get Started?
Impress your audience and streamline your workflow with GraphiSlides!
Install Free Add-onNo credit card required for free plan.