Quarterly Gantt Chart
This template presents a visual timeline for project or task management, broken down by calendar quarters.
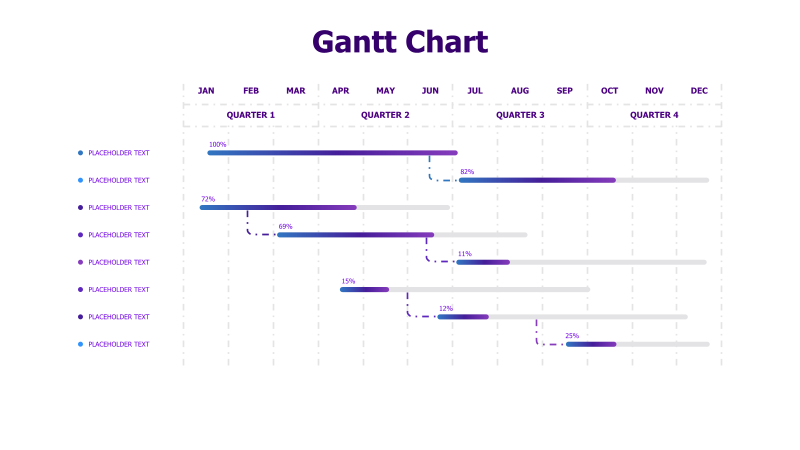
Layout & Structure: The template features a horizontal Gantt chart spanning twelve months, divided into four quarters (January-March, April-June, July-September, October-December). It displays eight distinct tasks or project phases represented by horizontal bars. Each bar's length indicates the duration of the task, and its position shows the start and end dates. Percentage completion is indicated next to each task.
Style: The chart utilizes a clean, modern aesthetic with a light color palette. The bars are colored in shades of purple and blue, providing visual distinction. A subtle grid background enhances readability. The overall design is professional and easy to understand.
Use Cases:
- Project planning and scheduling
- Tracking task progress over time
- Visualizing project timelines for stakeholders
- Resource allocation and management
- Presenting quarterly goals and achievements
Key Features:
- Clear visual representation of project timelines
- Easy-to-understand progress indicators
- Customizable task names and durations
- Visually appealing and professional design
- Quarterly breakdown for focused planning
Tags:
Ready to Get Started?
Impress your audience and streamline your workflow with GraphiSlides!
Install Free Add-onNo credit card required for free plan.