Yearly Business Activity Column Chart
This template presents business activity over a year using a column chart.
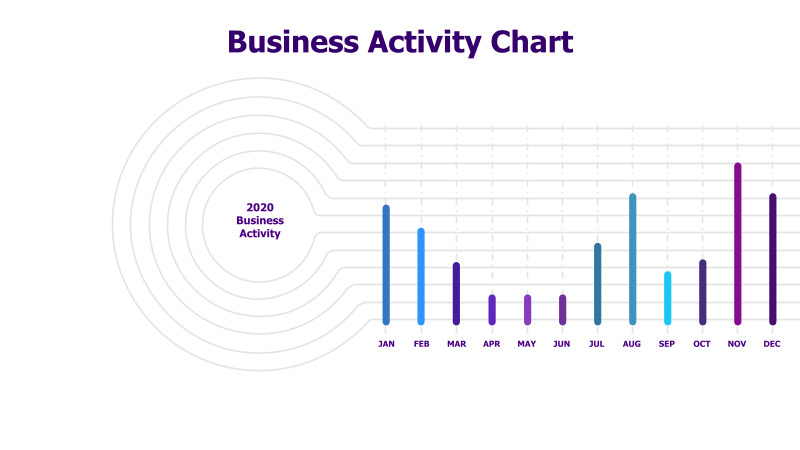
Layout & Structure: The template features a horizontal column chart displaying business activity across twelve months (January to December). The chart uses vertical bars of varying heights to represent activity levels for each month. A circular graphic with "2020 Business Activity" is placed on the left side.
Style: The chart employs a clean and modern aesthetic with a blue and gray color scheme. The bars have a simple, flat design. The overall style is professional and easy to understand.
Use Cases:
- Tracking monthly sales performance.
- Visualizing website traffic over time.
- Illustrating project milestones and progress.
- Presenting key performance indicators (KPIs) for each month.
- Demonstrating seasonal trends in business activity.
Key Features:
- Clear and concise data visualization.
- Easy-to-understand monthly breakdown.
- Visually appealing and professional design.
- Fully customizable data points and labels.
Tags:
column chartbusinessactivitymonthlyyearlydata visualizationperformancekpichartgraph2020
Ready to Get Started?
Impress your audience and streamline your workflow with GraphiSlides!
Install Free Add-onNo credit card required for free plan.