Gantt Chart with Checkmarks
This template provides a visual representation of a project timeline using a Gantt chart format, enhanced with checkmarks to indicate task completion or status.
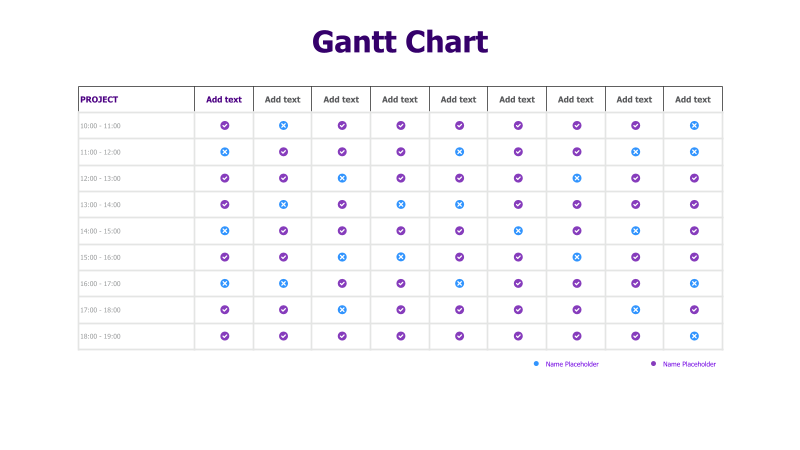
Layout & Structure: The template features a table-like structure with time slots listed vertically (10:00-19:00) and project phases or team members represented horizontally. Each cell represents a specific time block for a particular project element. Checkmarks and 'X' marks are used within the cells to denote status.
Style: The design is clean and minimalist, utilizing a light color palette with purple and blue accents. The use of checkmarks and 'X' marks provides a clear and immediate visual indication of progress. The overall aesthetic is professional and easy to understand.
Use Cases:
- Project Management: Tracking task completion and deadlines.
- Scheduling: Visualizing team member availability and assignments.
- Time Management: Planning and monitoring daily or weekly activities.
- Progress Reporting: Communicating project status to stakeholders.
- Workflow Visualization: Illustrating the sequence of tasks in a process.
Key Features:
- Clear visual timeline.
- Easy-to-understand status indicators (checkmarks and 'X' marks).
- Fully customizable time slots and project elements.
- Suitable for various project management methodologies.
- Simple and effective design.
Tags:
Ready to Get Started?
Impress your audience and streamline your workflow with GraphiSlides!
Install Free Add-onNo credit card required for free plan.