Gantt Chart - Project Timeline
This template provides a visual representation of a project timeline using a Gantt chart format. It's ideal for showcasing project schedules, task durations, and progress.
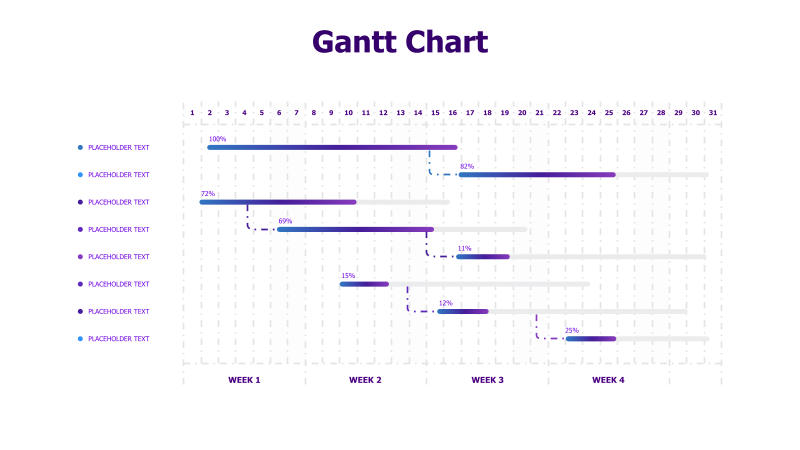
Layout & Structure: The template features a horizontal bar chart with tasks listed vertically on the left. Each bar represents a task's duration, spanning across a timeline marked in weeks (1-4) and days (1-31). Percentage completion is indicated for each task. The chart consists of eight distinct tasks.
Style: The chart employs a clean, modern aesthetic with a purple and white color scheme. The use of subtle gridlines enhances readability. The bars are solid, providing a clear visual representation of task progress. The overall style is professional and easy to understand.
Use Cases:
- Project Management: Track project timelines and task completion.
- Schedule Planning: Visualize project schedules and dependencies.
- Progress Reporting: Communicate project progress to stakeholders.
- Resource Allocation: Plan and allocate resources effectively.
- Task Management: Organize and prioritize tasks.
Key Features:
- Clear visual timeline.
- Percentage completion indicators.
- Easy-to-understand task representation.
- Professional and modern design.
- Fully customizable task labels and durations.
Tags:
Ready to Get Started?
Impress your audience and streamline your workflow with GraphiSlides!
Install Free Add-onNo credit card required for free plan.