2-Point Balance Infographic
This template visually represents a comparison or balance between two concepts.
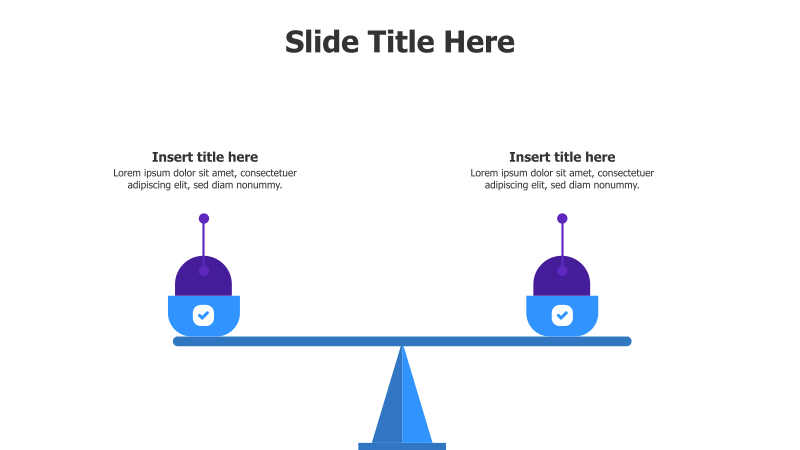
Layout & Structure: The slide features a balanced scale with two identical points suspended on either side. Each point is represented by a rounded square with a checkmark inside, connected to the scale by a vertical line. The scale itself is a simple triangular prism. There are two text boxes above each point for titles and descriptions.
Style: The design employs a clean, modern aesthetic with a flat design and a blue color scheme. The use of rounded shapes and a simple scale creates a visually appealing and easy-to-understand graphic. The overall look is professional and minimalist.
Use Cases:
- Comparing two options or strategies.
- Illustrating a balanced decision-making process.
- Presenting pros and cons.
- Demonstrating equal importance of two factors.
- Highlighting a fair assessment.
Key Features:
- Simple and clear visual representation.
- Fully customizable text and colors.
- Easy to understand and interpret.
- Professional and modern design.
Tags:
Ready to Get Started?
Impress your audience and streamline your workflow with GraphiSlides!
Install Free Add-onNo credit card required for free plan.