World Map with Bubble Markers
This template presents a world map visualization using bubble markers of varying sizes.
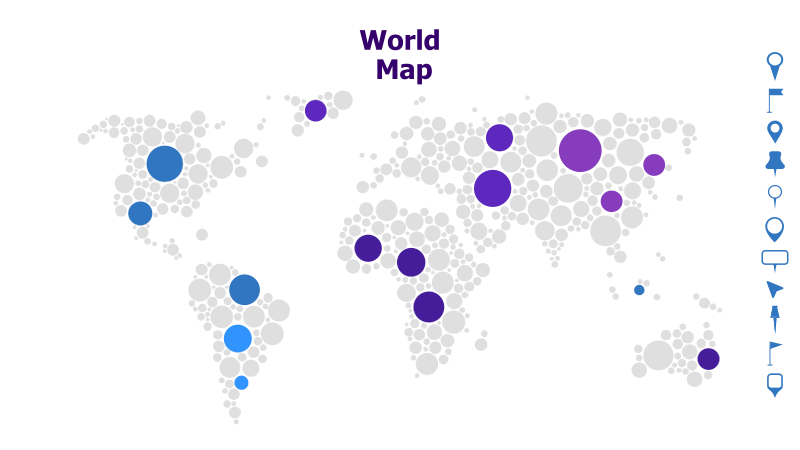
Layout & Structure: The template features a world map outline constructed from numerous small circles. Larger circles, representing data points, are overlaid on the map, with their size likely corresponding to a specific value or metric. The map is divided into continents, with a focus on global representation.
Style: The design employs a minimalist aesthetic with a light gray background and blue/purple bubble markers. The use of circles creates a modern and clean look. The varying sizes of the bubbles add visual interest and emphasize data differences.
Use Cases:
- Visualizing global data distributions (e.g., sales, population, internet usage).
- Highlighting key regions or countries based on specific metrics.
- Presenting international market analysis.
- Demonstrating global trends and patterns.
- Showing geographical impact of events or initiatives.
Key Features:
- Clear geographical representation.
- Visually engaging bubble marker design.
- Effective for comparing data across locations.
- Customizable bubble sizes and colors.
- Suitable for a wide range of global data presentations.
Tags:
Ready to Get Started?
Impress your audience and streamline your workflow with GraphiSlides!
Install Free Add-onNo credit card required for free plan.