Gantt Chart - Monthly Timeline
This template provides a visually clear Gantt chart for project scheduling and timeline representation.
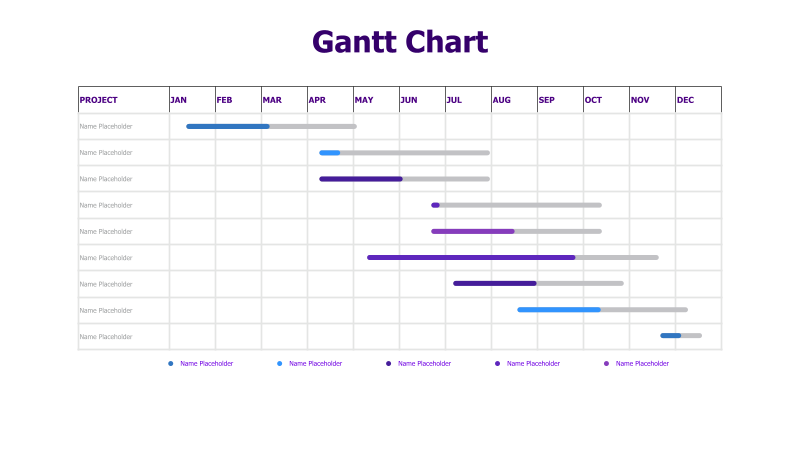
Layout & Structure: The template features a horizontal timeline spanning from January to December. It includes a series of horizontal bars representing project tasks or phases, aligned with corresponding month labels. There are eight distinct project rows, each with a unique color. The bars indicate the duration of each task.
Style: The design is clean and modern, utilizing a flat color palette with a light background. The bars are solid colors, providing clear visual distinction between tasks. The overall aesthetic is professional and easy to understand.
Use Cases:
- Project Management: Visualize project timelines and dependencies.
- Task Scheduling: Plan and track individual task durations.
- Timeline Presentations: Communicate project schedules to stakeholders.
- Resource Allocation: Show the allocation of resources over time.
- Progress Reporting: Demonstrate project progress against planned timelines.
Key Features:
- Clear Monthly Breakdown
- Visually Distinct Tasks
- Easy-to-Understand Timeline
- Fully Customizable Colors and Labels
- Suitable for Various Project Scales
Tags:
Ready to Get Started?
Impress your audience and streamline your workflow with GraphiSlides!
Install Free Add-onNo credit card required for free plan.