Fishbone Diagram Template
This template provides a visually structured Fishbone Diagram, also known as an Ishikawa diagram or cause-and-effect diagram, for root cause analysis.
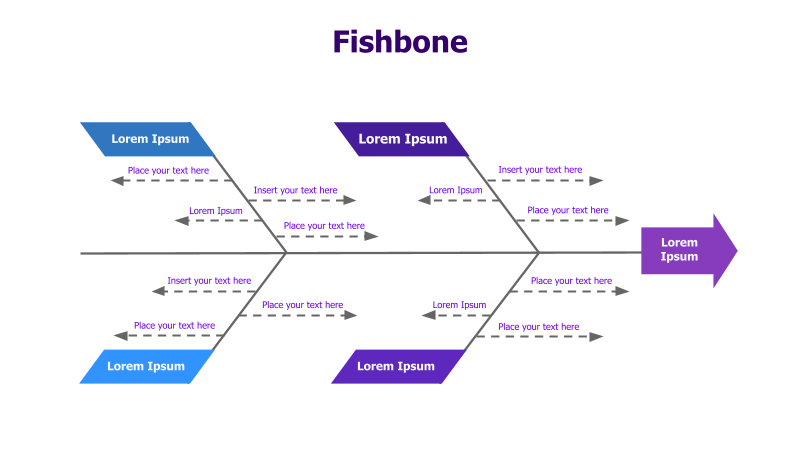
Layout & Structure: The template features a central spine representing the problem, with angled branches extending from it. These branches represent major categories of potential causes. Each main branch further subdivides into smaller branches, allowing for detailed exploration of contributing factors. The diagram has a hierarchical structure with multiple levels of causes and sub-causes.
Style: The design employs a clean and modern aesthetic with a flat color palette. The use of different colors for each main branch helps to visually distinguish categories. The dashed lines indicate relationships between causes and effects. The overall style is professional and suitable for business presentations.
Use Cases:
- Root cause analysis of problems or issues.
- Identifying potential causes of defects in manufacturing.
- Analyzing factors contributing to project delays.
- Exploring reasons for customer dissatisfaction.
- Brainstorming solutions to complex challenges.
Key Features:
- Fully editable text boxes for customization.
- Clear visual hierarchy for easy understanding.
- Multiple levels of branching for detailed analysis.
- Professional and modern design.
Tags:
Ready to Get Started?
Impress your audience and streamline your workflow with GraphiSlides!
Install Free Add-onNo credit card required for free plan.