21-Day Gantt Chart
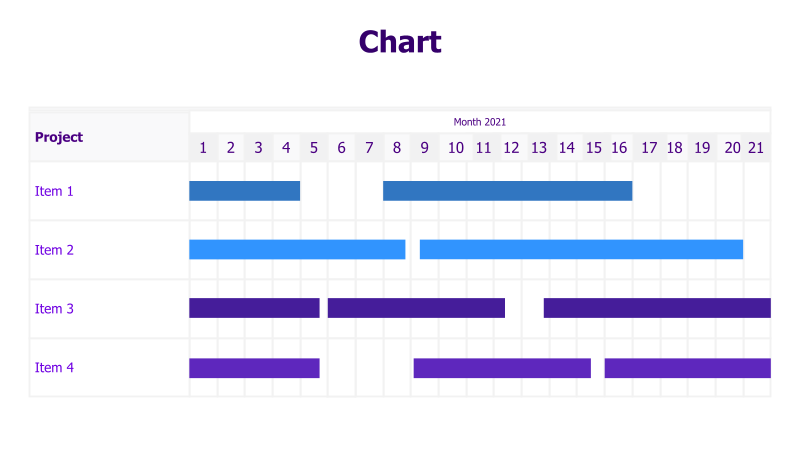
This template presents a visual timeline for project management, displaying tasks and their durations over a 21-day period.
Layout & Structure: The template features a horizontal Gantt chart with four project items displayed along the vertical axis. Each item is represented by a colored bar indicating its start and end dates. The horizontal axis represents the months of 2021, divided into 21 days. The bars visually represent the duration of each project item.
Style: The chart utilizes a clean and modern aesthetic with a light background and contrasting colored bars. The use of distinct colors for each project item enhances clarity and visual appeal. The overall style is professional and suitable for business presentations.
Use Cases:
- Project scheduling and tracking
- Timeline visualization
- Resource allocation planning
- Demonstrating project progress
- Presenting task dependencies
Key Features:
- Clear visual representation of project timelines
- Easy-to-understand task durations
- Visually distinct project items
- Suitable for various project management scenarios
- Fully customizable colors and labels
Tags:
Ready to Get Started?
Impress your audience and streamline your workflow with GraphiSlides!
Install Free Add-onNo credit card required for free plan.