Months Gantt Chart
This template provides a visual timeline for project management and scheduling.
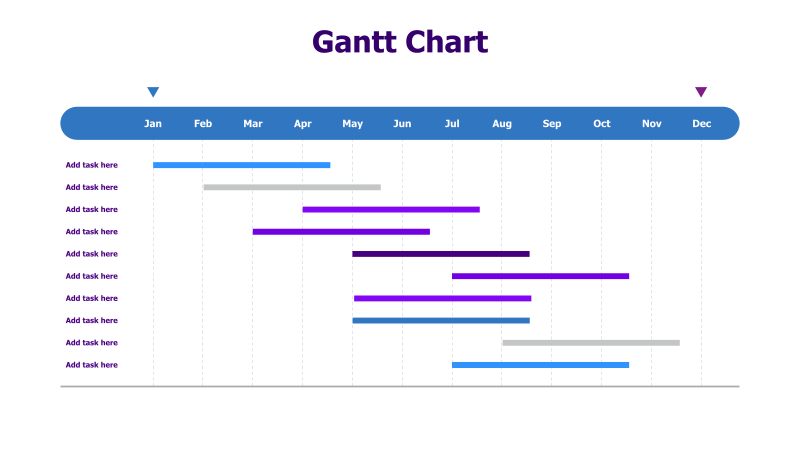
Layout & Structure: The template features a horizontal Gantt chart with a timeline spanning from January to December. It includes ten task rows, each represented by a colored bar indicating the duration of the task. The chart is designed for easy addition of tasks and adjustment of timelines.
Style: The chart utilizes a clean and modern aesthetic with a light color palette. The bars are solid colors, providing clear visual distinction between tasks. The overall design is professional and easy to understand.
Use Cases:
- Project planning and scheduling
- Timeline visualization
- Task management
- Resource allocation
- Progress tracking
Key Features:
- Clear monthly timeline
- Easy-to-edit task bars
- Visually appealing design
- Suitable for various project types
- Simple and intuitive to use
Tags:
gantt charttimelineproject managementscheduletasksplanningmonthshorizontalvisualbusiness
Ready to Get Started?
Impress your audience and streamline your workflow with GraphiSlides!
Install Free Add-onNo credit card required for free plan.