Months Gantt Chart
This template presents a visual timeline for project management or task tracking across a calendar year.
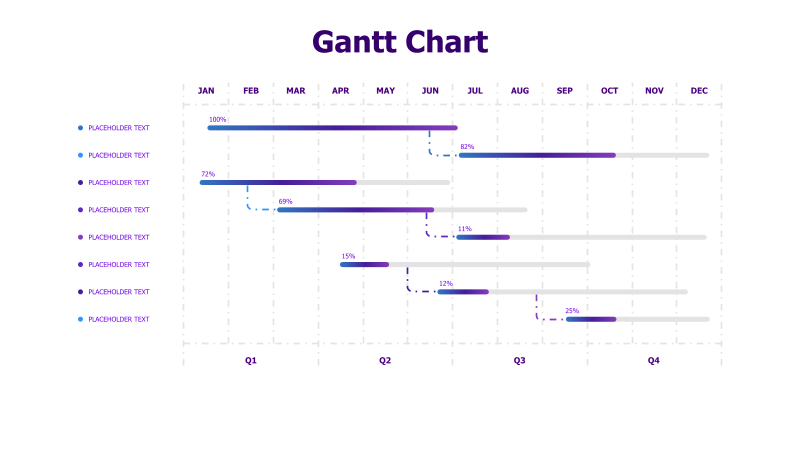
Layout & Structure: The template features a horizontal Gantt chart with tasks listed vertically on the left side. The chart spans twelve months (January to December), divided into quarterly sections (Q1, Q2, Q3, Q4). Each task is represented by a horizontal bar indicating its duration and start/end dates. Percentage completion is displayed for each task.
Style: The chart utilizes a clean and modern aesthetic with a light background and color-coded task bars. The use of quarterly markers and month labels enhances readability. The overall style is professional and suitable for business presentations.
Use Cases:
- Project planning and scheduling
- Tracking task progress over time
- Visualizing project timelines
- Resource allocation and management
- Reporting project status to stakeholders
Key Features:
- Clear visual representation of project timelines
- Easy-to-understand task durations and dependencies
- Percentage completion tracking
- Quarterly and monthly breakdowns for detailed monitoring
- Visually appealing and professional design
Tags:
Ready to Get Started?
Impress your audience and streamline your workflow with GraphiSlides!
Install Free Add-onNo credit card required for free plan.