Years Gantt Chart
This template provides a visual timeline for project management or historical data representation.
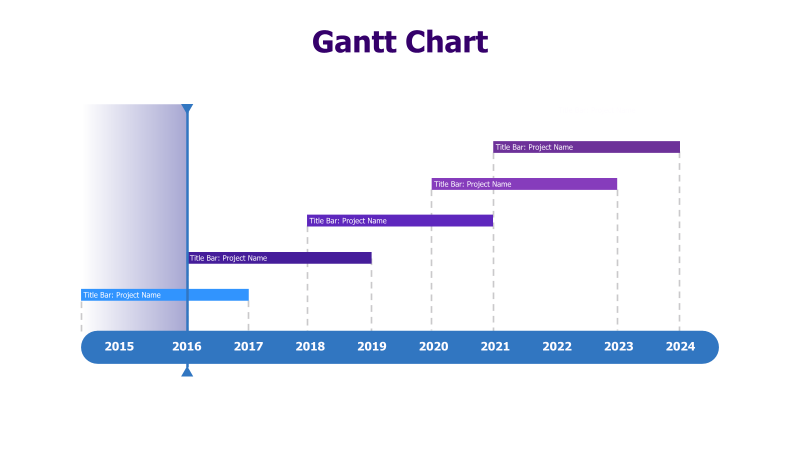
Layout & Structure: The slide features a horizontal Gantt chart with a timeline spanning from 2015 to 2024. It displays five project phases represented by colored bars of varying lengths, positioned along the timeline. Each bar represents a project or task, and its length indicates its duration. A vertical arrow points to the start of the timeline.
Style: The template employs a clean and modern aesthetic with a light background and distinct colored bars. The use of a timeline format provides a clear and organized visual representation of project schedules. The color scheme is professional and easy on the eyes.
Use Cases:
- Project planning and scheduling
- Timeline of historical events
- Tracking project milestones
- Visualizing project dependencies
- Presenting project progress to stakeholders
Key Features:
- Clear and concise timeline visualization
- Easy to understand project durations
- Visually appealing color scheme
- Fully customizable project names and dates
- Suitable for a wide range of project management applications
Tags:
Ready to Get Started?
Impress your audience and streamline your workflow with GraphiSlides!
Install Free Add-onNo credit card required for free plan.