TAM, SAM, SOM Market Sizing
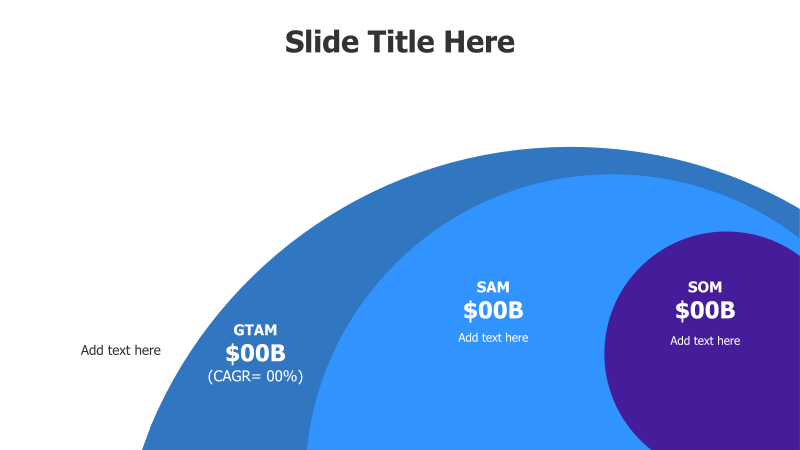
This template visually represents Total Addressable Market (TAM), Serviceable Available Market (SAM), and Serviceable Obtainable Market (SOM) using overlapping circles.
Layout & Structure: The template features three concentric, overlapping circles representing TAM, SAM, and SOM. The largest circle (green) represents the Total Addressable Market (GTAM), the middle circle (blue) represents the Serviceable Available Market (SAM), and the smallest circle (purple) represents the Serviceable Obtainable Market (SOM). Each circle contains a placeholder for the market size in billions of dollars and a text area for additional details. The CAGR is displayed under the GTAM.
Style: The template utilizes a modern and clean aesthetic with a gradient color scheme. The overlapping circles create a visually appealing and intuitive representation of market segmentation. The use of color helps to differentiate between the different market sizes.
Use Cases:
- Presenting market opportunity analysis.
- Illustrating target market size and potential.
- Communicating market segmentation strategy.
- Demonstrating the potential for growth within a specific market.
- Investor presentations.
Key Features:
- Clear visual representation of TAM, SAM, and SOM.
- Fully customizable market size values.
- Space for detailed descriptions of each market segment.
- Modern and professional design.
- Easy to understand and interpret.
Tags:
Ready to Get Started?
Impress your audience and streamline your workflow with GraphiSlides!
Install Free Add-onNo credit card required for free plan.