Fishbone Diagram Template
This template provides a visually appealing and structured format for creating a Fishbone (Ishikawa) diagram, also known as a cause-and-effect diagram. It's designed to help teams identify potential causes of a problem.
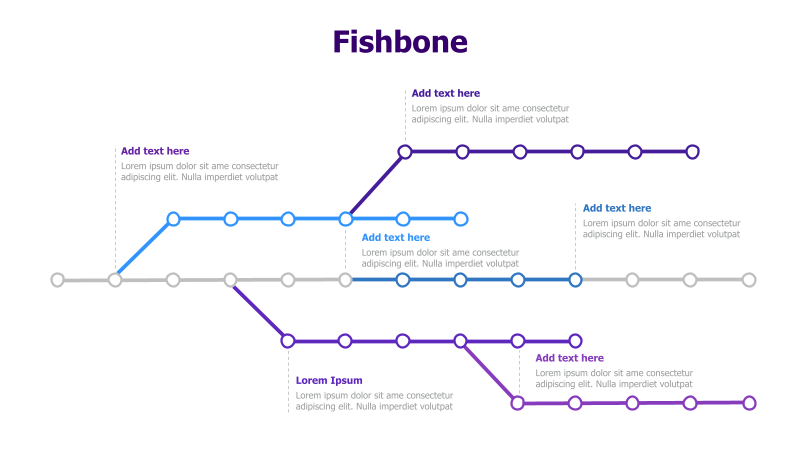
Layout & Structure: The template features a central horizontal line representing the problem or effect. Multiple diagonal lines branch off from this line, representing major categories of causes. Each category then has sub-branches, allowing for a detailed breakdown of potential contributing factors. The diagram includes six main branches with multiple levels of sub-branches.
Style: The diagram utilizes a clean, modern aesthetic with pastel-colored lines and circular nodes. The overall design is minimalist and professional, focusing on clarity and readability. The use of color helps to differentiate between cause categories.
Use Cases:
- Root cause analysis
- Problem-solving sessions
- Quality control improvement
- Identifying factors contributing to project delays
- Analyzing customer complaints
Key Features:
- Fully customizable text boxes
- Clear visual hierarchy for easy understanding
- Multiple levels of branching for detailed analysis
- Professional and modern design
- Suitable for a wide range of problem-solving scenarios
Tags:
Ready to Get Started?
Impress your audience and streamline your workflow with GraphiSlides!
Install Free Add-onNo credit card required for free plan.