2-Point Comparison from a Circle Infographic
This template provides a visually engaging way to compare two distinct concepts or ideas.
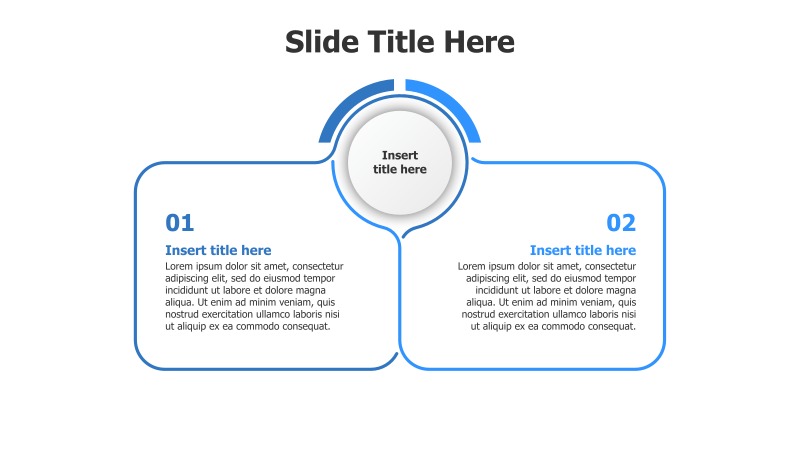
Layout & Structure: The template features a circular design with two prominent sections, labeled '01' and '02', connected by a central circular element. Each section contains a title area and a text block for detailed explanations. The circular arrangement emphasizes the interconnectedness or relationship between the two points.
Style: The design incorporates a modern aesthetic with a 3D effect, subtle shadows, and a blue color scheme. The use of rounded shapes and clean lines contributes to a professional and approachable look. The overall style is visually appealing and easy to understand.
Use Cases:
- Comparing two product features.
- Presenting pros and cons of different strategies.
- Highlighting two different approaches to a problem.
- Contrasting two market segments.
- Illustrating two sides of an argument.
Key Features:
- Clear and concise visual representation.
- Fully editable text and shapes.
- Modern and professional design.
- Easy to customize with your own content.
- Visually appealing 3D effect.
Tags:
Ready to Get Started?
Impress your audience and streamline your workflow with GraphiSlides!
Install Free Add-onNo credit card required for free plan.