Project Timeline Gantt Chart
This template provides a visually appealing Gantt chart for project management and timeline visualization.
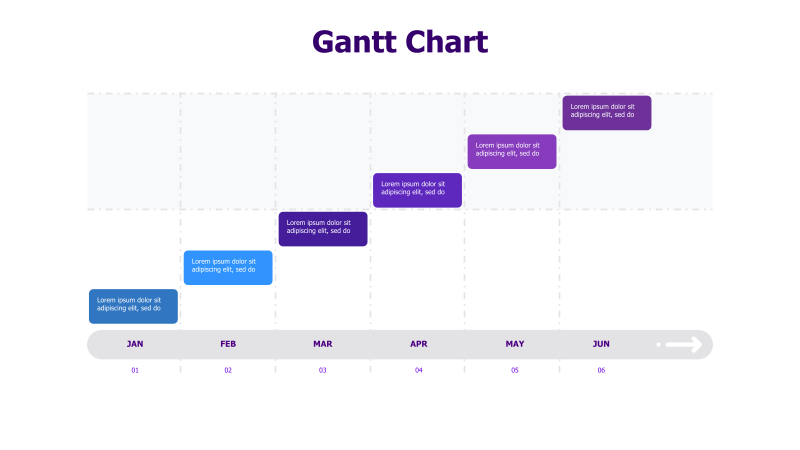
Layout & Structure: The template features a horizontal timeline spanning from January to June. It utilizes rectangular bars to represent tasks or project phases, positioned along the timeline to indicate their start and end dates. The bars are arranged in a staggered fashion, creating a clear visual representation of project progression. There are 5 tasks shown.
Style: The design employs a modern aesthetic with a light background and purple accents. The bars are filled with a light purple color and contain placeholder text. A subtle grid pattern provides structure without being distracting. The overall style is clean and professional.
Use Cases:
- Project planning and scheduling
- Timeline presentations
- Task management
- Demonstrating project milestones
- Visualizing project dependencies
Key Features:
- Clear and concise timeline visualization
- Easy-to-understand task representation
- Visually appealing design
- Fully customizable with editable text and colors
- Suitable for a wide range of project types
Tags:
Ready to Get Started?
Impress your audience and streamline your workflow with GraphiSlides!
Install Free Add-onNo credit card required for free plan.