Years Gantt Chart
This template presents a timeline-based chart ideal for showcasing project milestones or progress over several years.
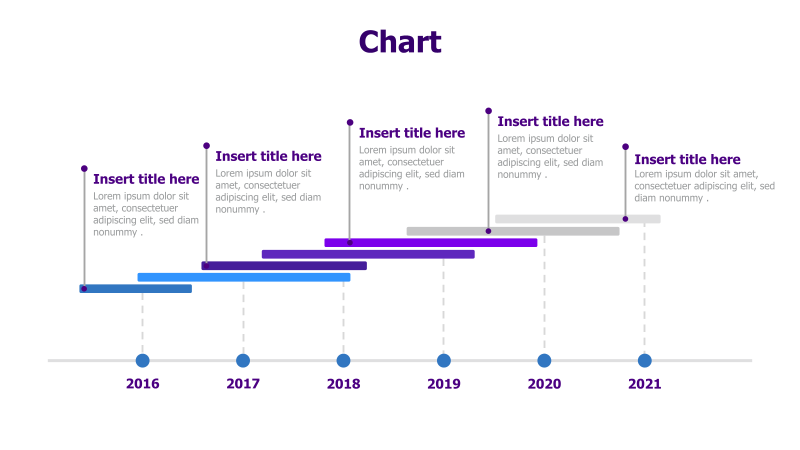
Layout & Structure: The template features a horizontal timeline spanning from 2016 to 2021. Each year has a corresponding point and a horizontal bar extending to the right, representing duration or progress. Text boxes are positioned above each point for titles and descriptions. The bars are color-coded, with a gradient effect.
Style: The design employs a clean and modern aesthetic with a light color palette. The use of gradients on the bars adds visual interest. The overall style is professional and suitable for business presentations.
Use Cases:
- Project timelines and schedules
- Roadmap presentations
- Tracking key milestones
- Illustrating progress over time
- Presenting historical data
Key Features:
- Clear visual representation of time-based events
- Customizable colors and text
- Easy-to-understand format
- Suitable for various project management scenarios
Tags:
Ready to Get Started?
Impress your audience and streamline your workflow with GraphiSlides!
Install Free Add-onNo credit card required for free plan.