Comparative Bar Chart
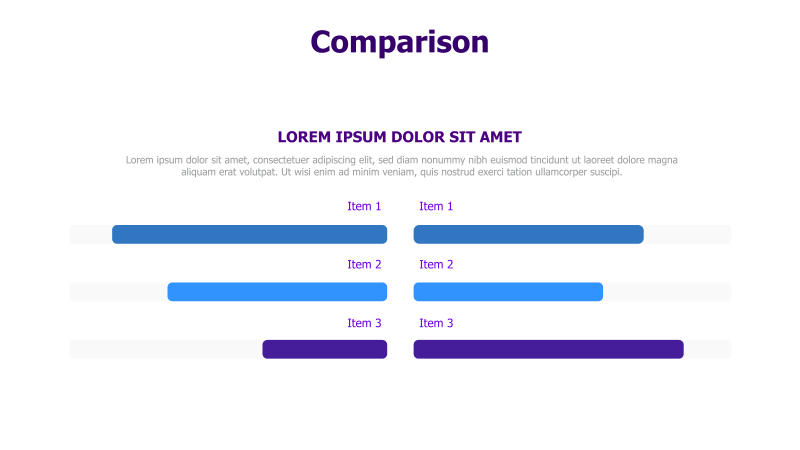
This slide template presents a clear visual comparison between three items using horizontal bar charts.
Layout & Structure: The template features three pairs of horizontal bar charts, positioned vertically. Each pair represents a comparison between 'Item 1', 'Item 2', and 'Item 3' on the left and right sides. A title and descriptive text area are positioned above the charts. The bars are of varying lengths to indicate different values.
Style: The design employs a modern aesthetic with a light purple and blue color scheme. The bars have a flat, solid color fill with subtle shadows to create a sense of depth. The overall look is clean and professional.
Use Cases:
- Comparing sales figures for different products.
- Illustrating market share between competitors.
- Presenting survey results for different demographics.
- Highlighting performance metrics across different teams.
- Showing the relative importance of different features.
Key Features:
- Easy-to-understand visual comparison.
- Clean and modern design.
- Fully customizable bar lengths and colors.
- Clear labeling for each item.
Tags:
Ready to Get Started?
Impress your audience and streamline your workflow with GraphiSlides!
Install Free Add-onNo credit card required for free plan.