Yearly Gantt Chart Planner
This template provides a visual timeline for planning and tracking projects or tasks throughout the year.
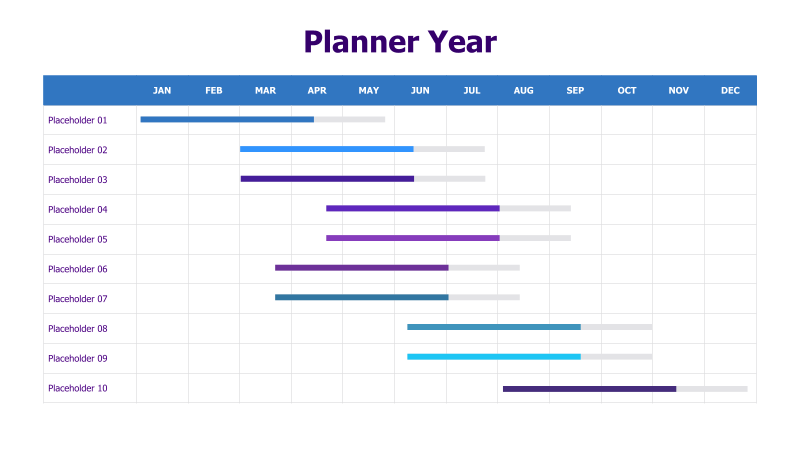
Layout & Structure: The template features a horizontal Gantt chart with ten rows, each representing a different placeholder task or project. The chart spans the entire year, divided into monthly columns from January to December. Each row displays a colored bar indicating the duration of the task.
Style: The design is clean and modern, utilizing a flat color palette with distinct hues for each task. The grid background provides a clear structure, and the color-coding enhances visual organization. The overall aesthetic is professional and easy to understand.
Use Cases:
- Project Management: Visualize project timelines and dependencies.
- Content Calendar: Plan and schedule content creation and publication.
- Marketing Campaigns: Track campaign milestones and deadlines.
- Event Planning: Organize event tasks and timelines.
- Personal Planning: Manage personal goals and deadlines throughout the year.
Key Features:
- Clear visual representation of timelines.
- Easy to understand and interpret.
- Color-coded for quick identification of tasks.
- Fully customizable with editable placeholders.
Tags:
Ready to Get Started?
Impress your audience and streamline your workflow with GraphiSlides!
Install Free Add-onNo credit card required for free plan.