5-Point Pie Chart with Descriptions
This template features a visually appealing pie chart designed for presenting proportional data with accompanying descriptive text.
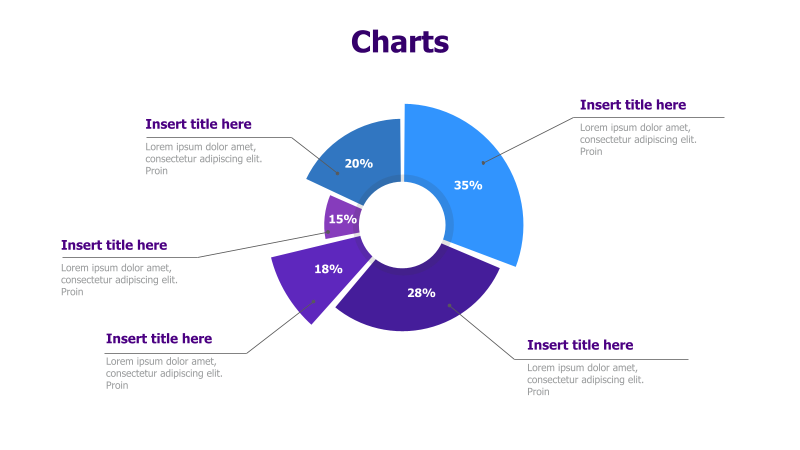
Layout & Structure: The slide showcases a 5-point pie chart, centrally positioned. Each slice of the pie is labeled with a percentage value. Surrounding the chart are four text boxes, each intended for a title and a brief description related to a specific segment of the pie. The arrangement allows for a clear association between each pie slice and its corresponding explanation.
Style: The template employs a modern and clean aesthetic. The pie chart utilizes a vibrant color palette with a subtle gradient effect. The text boxes are designed with a minimalist approach, using a clear font and a simple underline for the title. The overall design is professional and easy to understand.
Use Cases:
- Presenting market share data.
- Illustrating budget allocation.
- Showing the breakdown of project tasks.
- Analyzing customer demographics.
- Reporting survey results.
Key Features:
- Fully editable pie chart segments and text boxes.
- Clear visual representation of proportional data.
- Professional and modern design.
- Easy to customize with your own data and branding.
Tags:
Ready to Get Started?
Impress your audience and streamline your workflow with GraphiSlides!
Install Free Add-onNo credit card required for free plan.