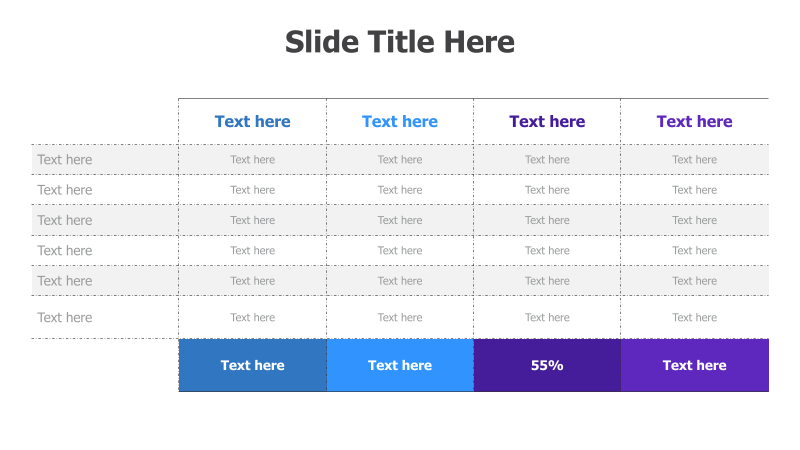
6-Level Stacked Table with Percentage
This template features a stacked table design with six levels, ideal for presenting information in a structured and comparative manner.
Layout & Structure: The template consists of a table with six rows and four columns. The top row features colored boxes with text placeholders. The subsequent rows contain multiple text placeholders within each column, creating a grid-like structure. The bottom row features colored boxes with text and a percentage value.
Style: The design employs a clean and modern aesthetic with a subtle use of color. The boxes have a flat design with rounded corners. The use of a percentage value adds a quantitative element. The overall look is professional and easy to read.
Use Cases:
- Presenting comparative data across different categories.
- Illustrating project phases or stages.
- Showcasing different product features or benefits.
- Displaying survey results or statistical data.
- Highlighting key performance indicators (KPIs).
Key Features:
- Fully editable text placeholders.
- Clear and organized table structure.
- Visually appealing color scheme.
- Suitable for a wide range of data presentation needs.
- Includes a percentage display for quantitative analysis.
Tags:
Ready to Get Started?
Impress your audience and streamline your workflow with GraphiSlides!
Install Free Add-onNo credit card required for free plan.